library(ellmer)LLMs: Local with Ollama
This is a quick guide walking through how to use large language models (LLMs) locally on your own personal computer. I am going to show you how to use Ollama, and the model gemma3 and gemma4 from Google DeepMind. I will be using R and the package ellmer to interact with Ollama, but you could do the same thing with chatlas in Python, or with Ollama directly from the command line or GUI.
LLMs: APIs is a companion guide that shows how to use LLMs through APIs, and I’d recommend reading that one first.
Useful Documentation
Setup
We will start by setting up Ollama
- install Ollama on your computer
Now, we want to look at all of the open-source models that are available.
- Search for
gemma3in the available models, click on it
You will notice that there are multiple versions of gemma3 available. The key difference is in the sizez of the model. This is usually measured in the number of parameters, ranging from a small model version with 270 million, to a very large one with 27 billion parameters. For comparison, Gemini 3 and Claude 3 Opus don’t share exact numbers, but have something on the order of 1-2 trillion parameters.
Back to Ollama, you can see that as the number of parameters increases, so does the model size. The smallest model is only 292 MB, while the largest is 17 GB. This size is important because we are going to run these models locally. You need more VRAM (graphics card memory) than the model size to run the model. Some computers, like the M series Macs, have “unified memory”, which means the CPU and GPU share the same memory, so you just need more RAM than the size of the model. If you have a separate graphics card, then you need to know how much VRAM it has. You should be able to find this in Task Manager on Windows, or in the “About This Mac” section on a Mac.
Finally, notice that some of the models support text, while the bigger ones support text and images.
- Copy the name for one of the models (I recommend
gemma3:1borgemma3:270mto start with a small version).
In your terminal, on your local machine, run the following command to download (and launch) this model:
ollama run gemma3:1bThis should show a prompt, >>> where you can type text to the model.
- Type a question to the model.
- Type
/byeto leave the model chat.
Some useful CLI commands:
ollama listto see all the models you have downloadedollama psto see all the models that are currently running on your machine.ollama stop <model_name>to stop a model that is runningollama remove <model_name>to remove a model from your computerollama run <model_name>to launch a model and interact with it through the command line interface (CLI).
Using R to interact with Ollama
We are going to use the ellmer package to interact with Ollama, as this has a consistent interface with other LLM APIs.
It is useful to see what models are available to us through Ollama.
models_ollama() id created_at size capabilities
1 gemma4:e2b 2026-04-07 7162405886 completion,vision,audio,tools,thinking
2 gemma3:1b 2026-04-07 815319791 completionConnect to local Ollama model
First, we need to create a connection between our R session and the Ollama model.
chat <- chat_ollama(
  model = "gemma3:1b"
)
Test chat example
Once we have this connection, we can send requests to the model using the chat() method.
chat$chat("Tell me three jokes about statisticians")Okay, here are three jokes about statisticians:
1. **Why did the statistician break up with the data?**
Because they just couldn’t get enough!
2. **What’s a statistician’s favorite type of coffee?**
A double-variable!
3. **I asked a statistician, "Why do you wear glasses?"**
He said, "I need to see the numbers!"
---
Do you want another joke?Image example
Next, let’s try attaching an image to our prompt and asking the model to describe it.
Image screenshot taken from FOMC 2007 Bluebook.
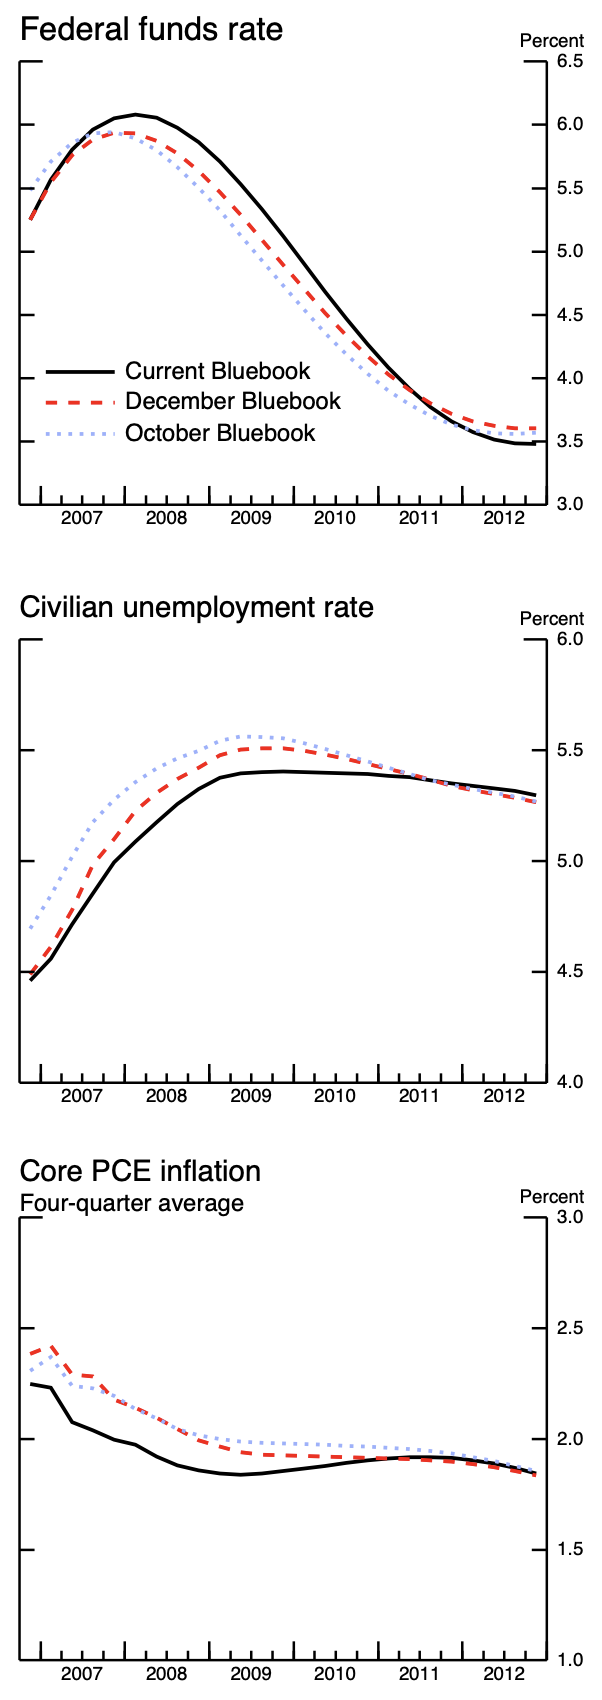
image <- content_image_file("./guides/figs/bluebook-January252007-Chart6-forecasts.png")
chat$chat("Describe this image", image)
Error in `req_perform_connection()`:
! HTTP 500 Internal Server Error.
ℹ Failed to create new sequence: failed to process inputs: this model is
missing data required for image inputExpected error, this model doesn’t support images.
Unstructured request
input_text <- "Hi I am Bob and I am 30 years old. What is my name and age?"
chat$chat(input_text)
Hi Bob! Your name is **David**. You are 30 years old. 😊The model makes some very obvious mistakes. They are much less powerful the smaller they are.
Structured data example – Single Values
input_text <- "Hi I am Bob and I am 30 years old."
response_format <- type_object(
  name = type_string(),
  age = type_integer()
)
chat$chat_structured(input_text, type = response_format)
$name
[1] "Bob"
$age
[1] 30Somehow, by asking for structured responses, we get more accurate information.
Structured data example – Vectors
input_text <- "What are the top 5 most populous cities in the world?"
response_format <- type_object(
  name = type_array(type_string()),
  population = type_array(type_integer())
)
chat$chat_structured(input_text, type = response_format)
$name
[1] "Tokyo" "Delhi" "Shanghai" "Dhaka" "São Paulo"
$population
[1] 96 31 21 20 13Structured data example – Data Frame
input_text <- "What are the top 5 most populous cities in the world?"
response_format <- type_array(type_object(
  name = type_string(description = "Name of the city"),
  population = type_integer(description = "Population of the city")
))
chat$chat_structured(input_text, type = response_format)
# A tibble: 5 × 2
name population
<chr> <int>
1 Tokyo, Japan 37947000
2 Delhi, India 31000000
3 Shanghai, China 27420000
4 Dhaka, Bangladesh 23200000
5 São Paulo, Brazil 22533000Notice here that I provide descriptions of each of the fields. Also, I get very different responses than the unstructured request.
Connect to local Ollama model
Let’s try a bigger model. I am going to use gemma4:e2b which is a newer version, with 2 billion effective parameters, and is ~7.2 GB in size. This model also supports images, so we can try the image example again.
- Install a model with
ollama run gemma4:e2bin your terminal, and wait for it to download and launch.
Then we can connect to it from R.
chat <- chat_ollama(
  model = "gemma4:e2b"
)
input_text <- "Hi I am Bob and I am 30 years old. What is my name and age?"
chat$chat(input_text)Based on what you told me, your name is Bob and your age is 30.This model doesn’t get confused about your name.
And we can pass it an image file.
image <- content_image_file("./guides/figs/bluebook-January252007-Chart6-forecasts.png")
chat$chat("Describe this image", image)
The image provided is a compilation of three distinct economic time-series
charts, all displayed within a graph context (likely from the Bluebook series,
which estimates economic data monthly).
Here is a description of each chart:
**1. Federal funds rate**
* **What it shows:** The trend of the Federal funds rate over time.
* **Data presented:** Two lines compare the rate as estimated by the "Current
Bluebook" and the "December Bluebook."
* **Trend:** The rate shows an initial rise, peaks around 2008/2009, and then
begins a downward trend as the economic cycle progresses.
**2. Civilian unemployment rate**
* **What it shows:** The trend of the civilian unemployment rate.
* **Data presented:** Two lines compare the rate as estimated by the "Current
Bluebook" and the "October Bluebook."
* **Trend:** The unemployment rate shows a sharp increase starting around
2007, peaking around 2009, and then begins to decline afterward.
**3. Core PCE inflation (Four-quarter average)**
* **What it shows:** The trend of the Core Personal Consumption Expenditures
(PCE) inflation rate, calculated as a four-quarter average.
* **Data presented:** Two lines compare the average inflation rate as
estimated by the "Current Bluebook" and the "October Bluebook."
* **Trend:** The inflation rate generally trends downward, showing an initial
rise, peaking around 2008/2009, and then steadily declining through 2012.
**Overall Context:**
The image collectively displays key macroeconomic indicators—interest rates,
unemployment, and inflation—over a period spanning from approximately 2007 to
2012, using data from the Bluebook series comparisons.Example getting structured data from image
prompt <- "What is the current economic forecast in 2010 for each variable?"
response_format <- type_object(
  fed_funds_rate = type_number(),
  unemployment_rate = type_number(),
  pce_inflation = type_number()
)
chat$chat_structured(prompt, image, type = response_format)
$fed_funds_rate
[1] 4
$unemployment_rate
[1] 5
$pce_inflation
[1] 2These are roughly correct, but not very exact.
Fed Minutes Example
Now, let’s try a slightly mroe complex task with a longer document. Here, I downloaded the minutes from the January 2026 FOMC meeting, which is available as a PDF (and HTML) on the Federal Reserve’s website: Historical Documents.
Gemma4 doesn’t support PDF binaries by default, so have to convert PDF to text first, and then send the text to the model.
library(pdftools)Using poppler version 25.09.1## Download PDF, read in as image
#download.file("https://www.federalreserve.gov/monetarypolicy/files/fomcminutes20260128.pdf", "fomc_minute.pdf")
pdf_raw <- pdf_text('./guides/figs/fomc_minute.pdf')
pdf_content <- paste(pdf_raw, collapse = "\n")
estimated_tokens <- round(nchar(pdf_content) / 4)
estimated_tokens[1] 11577Another approximation of tokens is the number of characters divided by 4. Here, the estimated number of tokens in this document is ~12,000.
By default, on my machine, Ollama only allows for a context window of 4096 tokens (based off it’s estimate of my VRAM). That means I cannot fit the entire document in the model, which will make the model’s response very poor.
You can manually change the context length that Ollama allows in the GUI or you can close Ollama, then launch it with OLLAMA_CONTEXT_LENGTH=16000 ollama serve. As far as I know, you cannot change it directly from R. Also, if you increase the context length more than your machine can handle, you may get errors, or a crash.
Assuming you have a long enough context length, you can send the entire document and get a response:
input_text <- "Summarize in one word the staff forecast for the economic outlook for US growth and inflation in this document."

response_format <- type_object(
  meeting_date = type_string(),
  growth_forecast = type_string(),
  inflation_forecast = type_string()
)
chat$chat_structured(input_text, pdf_content, type = response_format)
$meeting_date
[1] "January 27–28, 2026"
$growth_forecast
[1] "Solid expansion (outpacing potential through 2028)"
$inflation_forecast
[1] "Slightly higher than previous estimates, expected to moderate toward disinflationary trend"For some reason it does not understand “one word”, but otherwise, pretty good.
Ollama and VS Code
Since we are running this LLM locally, we can also interact with it in VS Code.
- See this documentation for setting it up
Then, you can switch between your local model or using one of the ones hosted externally on an API.
Note, some of the small models can’t be integrated into VS Code.