source("secrets.R")
library(ellmer)
Sys.setenv(GEMINI_API_KEY = my_gemini_api_key)LLMs: APIs
This is a quick guide walking through how to use large language models (LLMs) via APIs. I am going to show you how to use Google’s Gemini API (because it’s free with a google account). I will be using R and the package ellmer to interact with the API, but you could do the same thing with chatlas in Python, or with the API directly.
LLMs: Local with Ollama is a companion guide that shows how to use LLMs locally, and I’d recommend reading that one after this one.
Useful Documentation
Setup
You need to have a Google account with access to Google AI Studio. Sadly, Brown currently does not allow access to Google AI Studio through the Brown Google accounts, so you will need to use a personal account for this.
- Go to Google AI Studio, log in to your personal account.
- Click “Get Started” if you are on the welcome page
- Look for “Get API Key” and click on it or click on “Dashboard” and then “API Keys” in the left sidebar.
You should have a default API key created for you, but if not, you can create one by clickng “Create API Key”.
Google Gemini API
Now that you have your API key, you can use it to send programmatic requests to the Gemini API.
- In the code below, either create a file calle
secrets.Rwith the API key, or replacemy_gemini_api_keywith the actual API key string.
We will be using the ellmer package to interact with the Gemini API, but you could also use the API directly (through httr) or use a different package.
First, it is useful to ask for and display all available Gemini Models. You should be able to see these in Google AI studio as well.
models_google_gemini() |> head() id cached_input input output
1 deep-research-pro-preview-12-2025 NA NA NA
2 gemini-2.0-flash 0.02500 0.100 0.4
3 gemini-2.0-flash-001 0.02500 0.100 0.4
4 gemini-2.0-flash-lite 0.01875 0.075 0.3
5 gemini-2.0-flash-lite-001 NA NA NA
6 gemini-2.5-computer-use-preview-10-2025 NA NA NA- Setup chat connection
- Requires the API key to be set in the environment variable
GEMINI_API_KEY
- Requires the API key to be set in the environment variable
This creates a connection between our R session and the Gemini API, and allows ellmer to send requests to the API and receive responses.
chat <- chat_google_gemini(model = "gemini-3.1-flash-lite-preview")Text chat example
To chat wit the model, we use the built in method chat(), which sends a text prompt to the model and returns the model’s response as text.
chat$chat("Tell me three jokes about statisticians")Here are three jokes about statisticians:
1. **Why did the statistician break up with the probability density
function?**
Because their relationship was always under the curve!
2. **A statistician is someone who can find their way home by looking at the
stars, then use a sextant and a calculator to figure out where they *should*
have been.**
3. **What's the difference between an optimist, a pessimist, and a
statistician?**
The optimist says, "The glass is half full."
The pessimist says, "The glass is half empty."
The statistician says, "The glass is twice as big as it needs to be."Image example
Next, let’s try attaching an image to our prompt and asking the model to describe it.
Image screenshot taken from FOMC 2007 Bluebook.
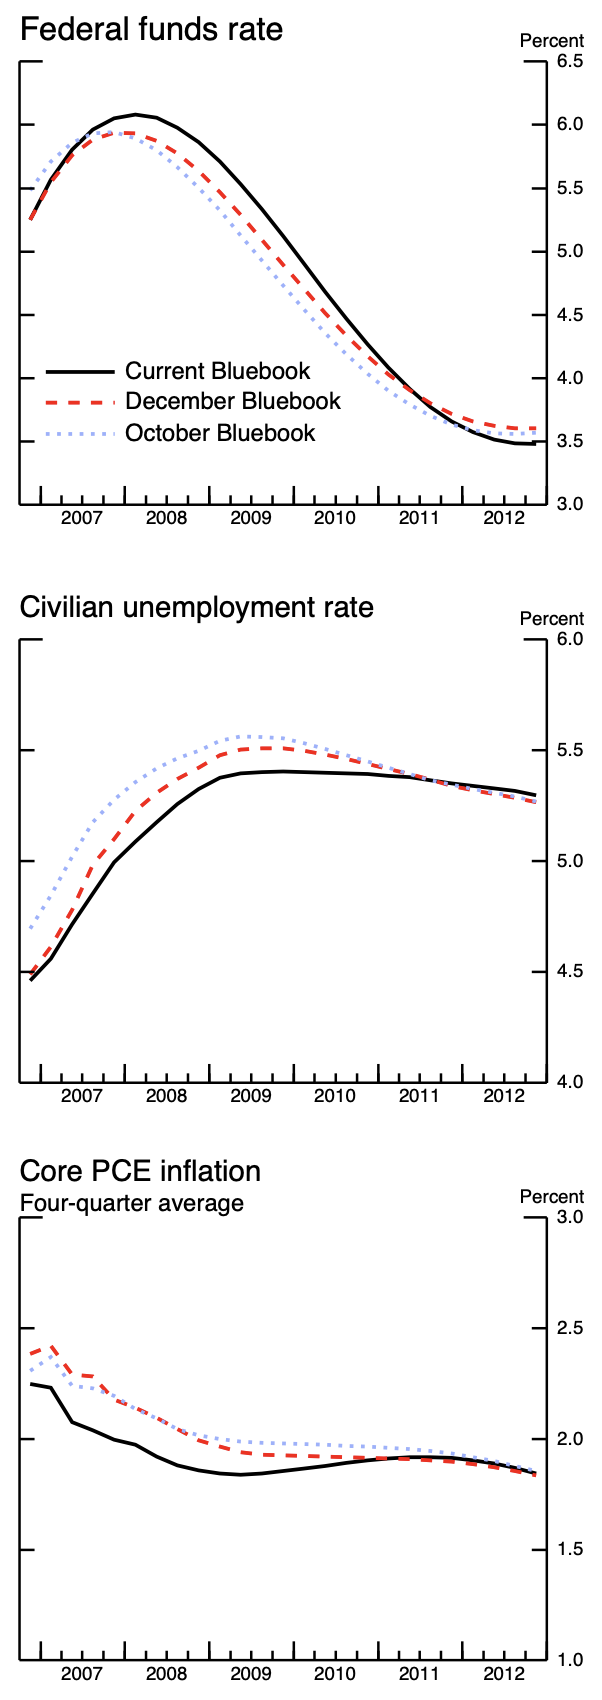
image <- content_image_file("./guides/figs/bluebook-January252007-Chart6-forecasts.png")
chat$chat("Describe this image", image)
The image displays three line graphs, each charting economic indicators over
time. The top graph shows the "Federal funds rate" from 2007 to 2012, with
three lines representing different "Bluebook" forecasts. The middle graph
illustrates the "Civilian unemployment rate" for the same period, also with
three "Bluebook" forecasts. The bottom graph tracks "Core PCE inflation," a
four-quarter average, also from 2007 to 2012, and includes the same three
"Bluebook" forecasts.
The "Federal funds rate" graph shows a peak around 2007, followed by a steady
decline. The "Civilian unemployment rate" graph shows an increase until around
2009, after which it begins to decline. The "Core PCE inflation" graph shows a
general downward trend from 2007 to around 2009, followed by a period of
relative stability. All three graphs are presented with a time axis at the
bottom and a percentage scale on the right side.Here, we made use of ellmer’s content_image_file() function, which reads in an image file and prepares it to be sent to the Gemini API. There are other content_*() functions for reading in different types of content, such as PDFs, HTML, and more.
Check token usage
One important thing to keep in mind when using LLMs is that they are priced base off of the number of tokens used in the prompt and response. A rough rule of thumb is that 1 word is 1.33 tokens, so a page of text (~500 words) is about 750 tokens. Since we are using the free tier of the Gemini API, we currently have no cost with our requests.
chat$get_tokens()# A tibble: 1 × 5
input output cached_input cost input_preview
<dbl> <dbl> <dbl> <ellmr_dl> <chr>
1 262 217 0 $0.00 Text[Describe this image], ImageInlineInstead, we are rate limited by:
- Requests per minute
- Tokens per minute
- Requests per day
You can see the exact limits (by model) on Google AI Studio.
Live chat interfaces
The elmmer package also has built in functions for creating live chat interfaces in the R console and in the browser. To create the browser interface, it will first prompt you to install the shinychat package, which is a dependency. These give a interactive experience with the model, like the chat interfaces you often see in your browser for all of the models.
live_console(chat)
live_browser(chat)
Unstructured request
One use of LLMs is to create structured data from unstructured text/images/inputs.
First, let’s simply ask the model to extract the name and age from the text prompt.
input_text <- "Hi I am Bob and I am 30 years old. What is my name and age?"
chat$chat(input_text)
Hi Bob! Your name is Bob and you are 30 years old.Notice, the model words it’s answer in a human readable way, with lots of extra text that we don’t need.
We can avoid this by asking the model to respond in a specific format, such as JSON. New models are trained to be able to respond in this specific format when asked.
Structured data example – Single Values
To ask for a JSON response, we use the chat_structured() method, which takes an additional argument type that specifies the format of the response. The type argument is created using the type_*() functions, which allow us to specify the data types we expect from the model.
Here, let’s ask for a JSON response with the name and age as separate fields.
input_text <- "Hi I am Bob and I am 30 years old."
response_format <- type_object(
  name = type_string(),
  age = type_integer()
)
chat$chat_structured(input_text, type = response_format)
$name
[1] "Bob"
$age
[1] 30The ellmer package is going to parse the JSON response from the model into R objects based off of the structure. In this case, we get a simple list with two elements.
Structured data example – Vectors
We can also tell the model to respond with vectors of data (rather than single values) by using the type_array() function.
input_text <- "What are the top 5 most populous cities in the world?"
response_format <- type_object(
  name = type_array(type_string()),
  population = type_array(type_integer())
)
chat$chat_structured(input_text, type = response_format)
$name
[1] "Tokyo" "Delhi" "Shanghai" "Dhaka" "Sao Paulo"
$population
[1] 37435191 29399141 26317104 21741090 21650181Again, ellmer is going to parse the JSON response into R objects, and we get a list with two elements, each of which is a vector of length 5.
Structured data example – Data Frame
In this case, this data would make more sense in a table format, like a data.frame or tibble.
To convey to ellmer that we want a data.frame, we ask for an array of objects, which ensures that each column of the data.frame will be the same length.
input_text <- "What are the top 5 most populous cities in the world?"
response_format <- type_array(type_object(
  name = type_string(),
  population = type_integer()
))
chat$chat_structured(input_text, type = response_format)
# A tibble: 5 × 2
name population
<chr> <int>
1 Tokyo 37435191
2 Delhi 29399141
3 Shanghai 26317104
4 Dhaka 21741090
5 Sao Paulo 21650181Example getting structured data from image
We can also ask the model for structured data from that image we used earlier.
prompt <- "What is the current economic forecast in 2010 for each variable?"
response_format <- type_object(
  fed_funds_rate = type_number(),
  unemployment_rate = type_number(),
  pce_inflation = type_number()
)
chat$chat_structured(prompt, image, type = response_format)
$fed_funds_rate
[1] 4.5
$unemployment_rate
[1] 5.4
$pce_inflation
[1] 1.9Fed Minutes Example
Let’s try a slightly more complex task. Here, I downloaded the minutes from the January 2026 FOMC meeting, which is available as a PDF (and HTML) on the Federal Reserve’s website: Historical Documents.
From there, I use ellmer to read in the PDF, and simply include it in the model request.1
1 Note, not all LLM’s have the ability to read PDF binanries, so you may have to first convert the PDF to text or an image.
input_text <- "Summarize in one word the staff forecast for the economic outlook for US growth and inflation in this document."

## Download PDF, read in as image
#download.file("https://www.federalreserve.gov/monetarypolicy/files/fomcminutes20260128.pdf", "fomc_minute.pdf")
pdf <- content_pdf_file("./guides/figs/fomc_minute.pdf")
response_format <- type_object(
  meeting_date = type_string(),
  growth_forecast = type_string(),
  inflation_forecast = type_string()
)
chat$chat_structured(input_text, pdf, type = response_format)
$meeting_date
[1] "January 27–28, 2026"
$growth_forecast
[1] "Stronger"
$inflation_forecast
[1] "Higher"Notice that in my prompt I did not explicitly ask for the date, but the model knows from the structure of the response format that it should include that information.
For a meeting during the crisis
Here’s another example, this time using the FOMC minutes from January 2009, and using the HTML version of the document. I download the html file, pull out the text (ie. drop all the HTML tags), and then send that text to the model.
url <- "https://www.federalreserve.gov/monetarypolicy/fomcminutes20090128.htm"
html <- rvest::read_html(url)
text <- rvest::html_text2(html)
chat$chat_structured(input_text, text, type = response_format)
$meeting_date
[1] "January 27-28, 2009"
$growth_forecast
[1] "Contracting"
$inflation_forecast
[1] "Low"Compare the token usage
Remember, each of our requests to the model uses up tokens. Notice that there is a big difference between the number of tokens used in our PDF and our HTML examples.
chat$get_tokens()# A tibble: 2 × 5
input output cached_input cost input_preview
<dbl> <dbl> <dbl> <ellmr_dl> <chr>
1 9382 46 0 NA Text[Summarize in one word the staff for…
2 23129 46 0 NA Text[Summarize in one word the staff for…For projects where you are paying for token input and output, it is important to do as much preprocessing as possible (ie. dropping irrelevant text).